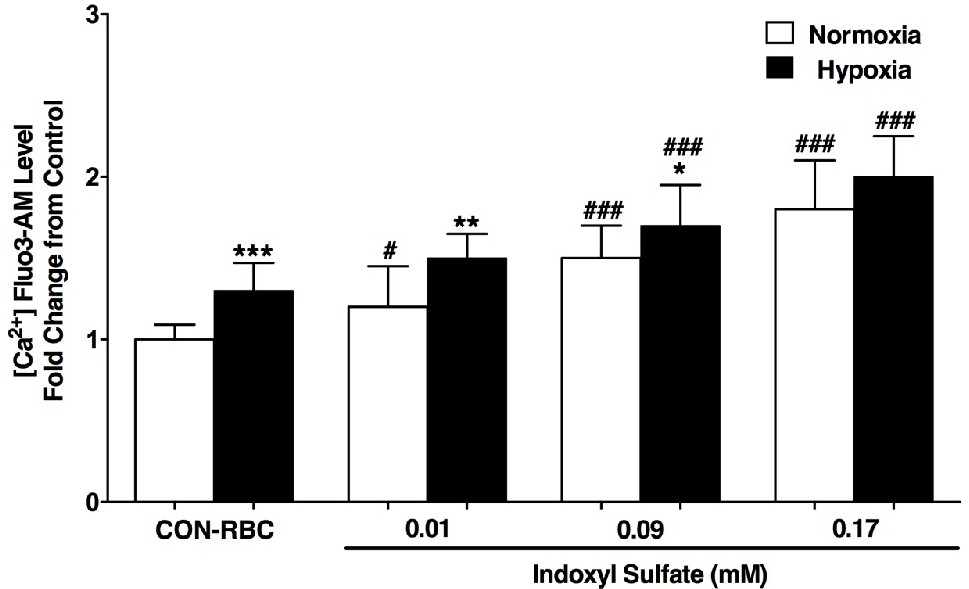
Fig. 4. RBC cytosolic calcium in response to the uremic and hypoxic condition. RBC obtained from healthy subjects (n=10) were treated with different concentrations of IS (0.01, 0.09, 0.17mM) for 24h at 37oC in an incubator with controlled oxygen under normoxic (21% O2) (white bars) or hypoxic (5% O2) (black bars) conditions. Control RBC (CON-RBC) were incubated with TRIS-Glc-BSA in normoxia and hypoxia. The analysis was realized by flow cytometry through Fluo-3AM fluorescence and the results were expressed as fold changes in fluorescent levels against CON-RBC in normoxia. *<0.05; **p<0.01; ***p<0.001 between normoxia versus hypoxia in the same group. #p<0.05; ###p<0.001 between CON-RBC versus IS concentration in the same group (normoxia vs normoxia; hypoxia vs hypoxia).